Grocery trade strategy
K Group is the second biggest grocery trade operator in Finland. Some 860 K-retailer entrepreneurs ensure good customer experiences for 1.2 million daily customers at K Group’s 1,100 grocery stores. Nearly 800 of the stores also offer online grocery services, supported by express deliveries with Wolt. Our grocery store chains are
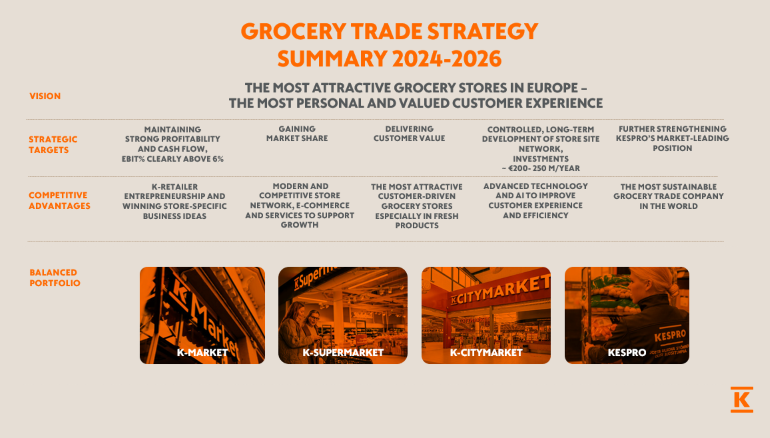
K-Citymarket, K-Supermarket and K-Market. Kespro is the leading foodservice wholesale provider in Finland.
Strategic focus areas:
- Maintaining profitability: The target is to maintain good profitability with an operating margin clearly above 6%
- Gaining market share
- Developing store site network: Expanding the store network in growth centres and updating a large number of stores.
- Improving price competitiveness: Improving price competitiveness with a systematic price program, financed by both Kesko and K-retailers.
- Raising the level of store-specific business ideas: Focusing on fixing the basics, actively monitoring store performance.
- Improving fresh departments: Restoring competitiveness in selected fresh departments.
- Investing in am omnichannel and personalised customer experience: Utilising advanced technology, e.g. AI, to further develop processes and improve efficiency.
- Inventing new business models for new sources of income: Investing in selected new businesses utilising K Group’s ecosystem, e.g. media and data business.
- Further strengthening Kespro’s market-leading position
Trends and operating environment:
Consumer confidence
- Consumer confidence still low
- Importance of price continues to be significant
- Offers and campaigns continue to be important
Demographic changes
- Population ageing, concentrated in growth centres
- Growing number of smaller households
- Store site network and selections must reflect the changes
Consumer megatrends
- Growing importance of convenience and eating out
- Increased focus on wellbeing for some consumers
- Important to address individual needs
Importance of data, AI, and digitalisation
- Growing role of data and digital services improving relevance
- Digitally-assisted sales growing
- New business formulated around data and digitalisation
Competition
- Continued high level of investments also from competitors
- Competing with both price and selections in physical stores and online
- Competition tightening further in online sales for home and speciality goods

Read more in Kesko's Annual Report.
Kesko updated its strategy in spring 2024. On 4 June 2024 we organised an investor event where President and CEO Jorma Rauhala and other members of Kesko’s top management presented the company’s updated strategy and focus areas for the three business divisions. The event was held in English. Watch the recording and related materials here.
Market
In 2024, the Finnish grocery retail market totalled some €23.4 billion (incl. VAT), representing an increase of some 2.0% (Finnish Grocery Trade Association’s statistics). Consumer purchase behaviour emphasised price, often opting for more affordable alternatives. Price competition in the Finnish grocery trade market intensified further as consumer purchasing power weakened. Online grocery sales continued to grow.
Market shares
GROCERY TRADE
Kesko’s market share in Finland was 33.9% (Kesko’s own estimate based on Nielsen’s comparison group which also includes discount stores and service stations). K Group is the second biggest operator in Finnish grocery trade. Our market share decreased in 2024 due to changes in our operating environment and consumer behaviour. Competitors: Prisma, S-market, Alepa/Sale and Food Market Herkku, ABC (S Group), Lidl, Tokmanni, Minimani, Halpa-Halli, R-kioski and M-chain stores.
The market share for K-Citymarket’s home and speciality goods (non-food) cannot be reliably calculated. Competitors: hypermarkets, department stores, discounters, specialist chains, and Finnish and international online stores.
KESPRO FOODSERVICE
Kespro is the market leader in foodservice wholesale in Finland. Kespro’s market share is estimated to have strengthened in 2024 to 49.1% (in the Finnish Grocery Trade Association’s foodservice wholesale peer group). The market for eating out suffered from weakened consumer confidence in 2024. The continued growth in Northern travel, especially by customers from abroad, had a positive impact on restaurant sales. On the other hand, the increase in working from home has impacted lunch sales in particular. Competitors: Meira Nova, Metro-tukku, Valio Aimo, Suomen Palvelutukkurit, and industrial direct deliveries and speciality wholesalers.
|
K Group's grocery trade |
Number of stores |
Retail and BtoB sales, VAT 0%, |
||
|
2024 |
2023 |
2024 |
Change, % |
|
|
K foodstores |
1,128 |
1,208 |
6,675.3 |
0.1 |
|
K-Citymarket, non-food |
82 |
81 |
605.9 |
-2.0 |
|
Kespro |
- |
- |
1,200.8 |
1.2 |
|
Grocery trade, total |
1,128 |
1,208 |
8,482.0 |
0.1 |
|
At the end of 2024, there were 82 K-Citymarket, 251 K-Supermarket, 730 K-Market and 65 other stores. In addition, 776 K Group grocery stores offered online grocery services. Kespro had 13 cash & carry outlets and an online outlet. |
||||
|
Key figures |
|
2024 |
2023 |
|
|
Net sales, € million |
|
6,381.4 |
6,351.6 |
|
|
Operating profit, comparable, € million |
|
438.0 |
444.8 |
|
|
Operating margin, comparable |
|
6.9 |
7.0 |
|
|
Return on capital employed, comparable, % |
|
16.0 |
17.4 |
|
|
Capital expenditure, € million |
|
276.0 |
303.7 |
|
|
Personnel, average |
|
6,346 |
6,257 |
|
|
Properties |
|
2024 |
2023 |
|
|
Owned properties, capital, € million |
|
1,206 |
1,097 |
|
|
Owned properties, area, 1,000 m² |
|
686 |
656 |
|
|
Leased properties, area, 1,000 m² |
|
1,394 |
1,411 |
|